Hello readers and welcome to the December edition of Technically Speaking.
It’s the end of the year already, but what a roller coaster ride 2022 has been (and it isn’t over yet)! While at it, the market played another game with the participants, that of musical chairs. We’ve had several sectors take on the leadership role one after the other, but never consistently together, until recently. For someone who stepped into the market arena in 2020, these last three years have been like a crash course of sorts! We had the 2020 Covid correction, Crude trading in negative, strong bounce back from stocks and commodities, Bond yields rally, US Dollar rally, Crypto correction, market recovery and many more events teaching us valuable lessons we need to learn.
It is important to note though, that all these trends didn’t play out overnight. There were signals that preceded these trends that alluded to a changing market environment. While it does seem overwhelming at first, it is really quite simple to be on the right side. You need to have a system in place. If you think you’re trading equities and therefore don’t need to track the Bond market, then you’re setting yourself up for a trap. Early in my career I had a system. And when I was new to the system, it was exciting, but eventually it became a routine.
The thing about routines is that you really have to stick to them. It can get boring sometimes, and with the non-stop dopamine supply of social media, we tend to crave excitement at all times. But one thing we tend to forget is that habits are formed by following routines. Routine means repetitive patterns, and that means that butterflies are not going to move in to your stomach on a long-term lease. But its worth noting that if the market is getting a big reaction out of you with every move, then you’re probably missing early signs of that move. So how do we combat that? Routine! Build a system that helps you track all the asset classes on a broad level and be aware of the inter-market relationships playing out. Dig a little deeper and compare examples in history to understand market cycles better. Doing this over a sustained period of time will replace excitement with curiosity. That’s when you know you’re on the right track. It is this transition from excitement to curiosity that helps us analyze the market better. The market speaks to us every day, we just have to listen.
On that note, here’s wishing everyone a wonderful holiday season!
I’ll see you again next year. Until then, think Technically!
Rashmi Bhatnagar, CMT
Editor
What's Inside...
President's Letter
by Brett Villaume, CMT, CAIAWhile I normally put on my Board of Directors hat to author the President’s Letter each month, this time I’m writing to you as a fellow dues-paying Member of the CMT Association. If I were to...
Five Good Signs for The Bulls In 2023
by Ryan Detrick, CMTCan you believe it? We made it to December! As we noted already, we wouldn’t be surprised if we finished this year with some more green, but today we’ll look into the future and what could...
What Did You Learn This Year?
by Shane C. Murphy, CMTWe’re a few weeks away from closing the book on 2022. Wow, what a rollercoaster year for the financial markets. New participants received a valuable education on how inflationary forces can alter...
SPY Remains Under Pressure But These Sectors Are Improving.
by Julius de KempenaerDisclaimer: Originally published on StockCharts.com Relative Strength Is Losing Its Concentration Recent sector rotation shows a relative strength loss for two of the three defensive sectors. This...
The Fed Chair Ignites a Rally
by Greg RiebenThe Fed Chair Ignites a Rally by Greg Rieben December 01, 2022 Stocks were in need of a catalyst after trading mostly unchanged for two weeks and Fed Chair Jerome Powell delivered. Every sector...
While I normally put on my Board of Directors hat to author the President’s Letter each month, this time I’m writing to you as a fellow dues-paying Member of the CMT Association. If I were to give this note a subtitle, it would be, “Why I Think The 50th Anniversary Symposium Is Totally Worth the Price”. In case you haven’t heard, the CMT Association turns 50 years old in 2023 – our golden anniversary – and we’re going to celebrate the milestone at the Annual Symposium in New York on April 26-28, 2023. The 2022 Symposium was held in Washington, D.C. and was our first hybrid, in-person/online conference, coming right on the heels of the COVID Pandemic. In-person attendees were very excited to be back at a live event, meeting with old friends and colleagues, but many people still had difficulties attending due to travel restrictions and employers’ work-from-home policies. The 50th will
To view this content you must be an active member of the CMT Association.
Not a member? Join the CMT Association and unlock access to hundreds of hours of written and video technical analysis content, including the Journal of Technical Analysis and the Video Archives. Learn more about Membership here.
Contributor(s)

Brett Villaume, CMT, CAIA
Brett Villaume, CMT, CAIA, is Past President of the CMT Association, having served on the Board of Directors since from 2014 to 2023. Additionally, Brett is a Wealth Advisor at Dogpatch Capital, a registered investment advisor in San Francisco, CA. From 2015 to 2021, Brett...
Can you believe it? We made it to December! As we noted already, we wouldn’t be surprised if we finished this year with some more green, but today we’ll look into the future and what could be in store in 2023. First things first, let’s start with something simple. Stocks will likely be lower this year; we can all agree there. How likely is the S&P 500 to be down two years in a row? The bottom line, it is pretty rare for back-to-back yearly losses, and we don’t expect it to happen this time either. In fact, over the past 50 years, it has only happened twice. There was a three-year losing streak after the tech bubble burst in 2000, 2001, and 2002, then back-to-back losses during the vicious recession of 1973 and 1974. So it ‘could’ happen, but we don’t see many similarities between now and those two times, suggesting
To view this content you must be an active member of the CMT Association.
Not a member? Join the CMT Association and unlock access to hundreds of hours of written and video technical analysis content, including the Journal of Technical Analysis and the Video Archives. Learn more about Membership here.
Contributor(s)

Ryan Detrick, CMT
Ryan Detrick, Senior Vice President, Chief Market Strategist, is a member of the LPL Financial Research tactical asset allocation committee, responsible for directly impacting the portfolio decision-making process, as well as a member of the market insights team, developing and...
We’re a few weeks away from closing the book on 2022. Wow, what a rollercoaster year for the financial markets. New participants received a valuable education on how inflationary forces can alter asset relationships. Growth equity investors severely underperformed, as higher rates proved to be too much for high growth, non-profitable companies. Market sentiment reached historical lows, as pessimism tied to the future prospects of the global economy plagued investors. Russia-Ukraine, PMIs crashing, yield curve inversion, FTX collapse…the list goes on. There’s been no shortage of reasons to grow skeptical of the markets – but all is not lost. Cycles need time to play out. In this environment, like every other, quality security selection and proper risk management is priority one.
It was suggested to me, that I take time in December to reflect on the year. What thesis did you abandon in 2022? What did you stick with? What’s changed since January? I’ve asked myself a lot of questions but none more important than, “What did you learn this year?”
The short answer is, quite a lot. But I’ll keep it to 3 things for the sake of your Sunday afternoon. Let’s get started.
1) Regime Changes Can Happen Fast!
Regime shifts can play out gradually at first, then all at once! Just take a look at the below chart of Russell 1000 Index: Growth vs. Value. The ratio formed a new weekly closing high in November 2021, but the subsequent 12-months saw consistent outperformance from Value. In the first week of January, the ratio made a sharp move lower beneath the 30 & 40-week moving average. It’s remained in a persistent downtrend in favor of Value ever since.
2) Don’t Fall in Love with an Asset Class
A tale of two halves. 1H 2022 saw significant outperformance of commodities over stocks. 2H saw the exact opposite. The 6M performance spread of SPX:SPGSCI as of today = +21.74% in favor of stocks. A great reminder to not fall in love with an asset class. Commodities formed new lows this week and if history is any indicator, they are typically the last to form a cycle bottom. Commodities did prove to be a strong diversifier this year. They played their role and earned a roster spot. The S&P Goldman Sachs Commodity Index is +17.8% on a YTD basis.
[image]
3) Beware or Be Aware of Home Country Bias
The below chart outlines the year-to-date performance spread of US equities vs. Non-US Equities (adjusted for dividends). Despite the monster run up in the US Dollar in 2022, Non-US equities (denominated in USD) are outperforming US equities on a year-to-date basis. I can’t understate this enough. Diversifying outside the US is as important to your portfolio as rebalancing or index/manager selection. Determining the optimal target weight of Non-US stocks is a different conversation, but it doesn’t take away from the fact that their presence in the portfolio is very important. Just take a look at the composition of various country indices. The US looks vastly different from Europe, Europe is different than Japan, so on and so forth. The source of return also varies. The indicated dividend yield on the S&P 500 is roughly 1.50%, on the MSCI ACWI Ex-US Index, the indicated dividend yield is nearly 3.75%. Two very different markets!
[image]
In the words of Leonardo da Vinci (who I hear was a fan of the Fibonacci sequence), “Learning never exhausts the mind.” If you find yourself operating within the financial markets, you will continue to learn, year after year in perpetuity. There is no book or knowledge source that can relinquish our need for continued learning. Markets evolve, relationships change, and if we as participants choose to ignore this, we will surely be dissatisfied with our results.
That’s enough out of me. I hope everyone enjoys the holiday season – best of luck as we head into 2023!
This material is intended for informational/educational purposes only and should not be construed as investment advice, a solicitation, or a recommendation to buy or sell any security or investment product. All indices are unmanaged and investors cannot actually invest directly into an index. Unlike investments, indices do not incur management fees, charges, or expenses. Past performance does not guarantee future results. Please contact your financial professional for more information specific to your situation.
Contributor(s)

Shane C. Murphy, CMT
Shane Murphy is an Associate at Michael Roberts Associates Inc. an independent wealth management firm located in Syracuse, NY. Prior to that, Shane worked in portfolio construction and research for an independent RIA. He also has experience in municipal finance, working at an...
Disclaimer: Originally published on StockCharts.com Relative Strength Is Losing Its Concentration 
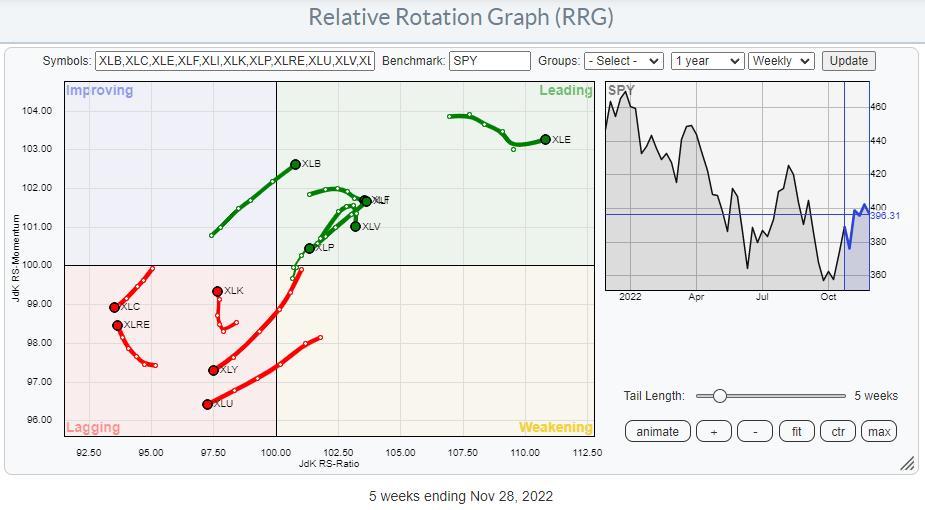
Recent sector rotation shows a relative strength loss for two of the three defensive sectors. This is a move away from the trend we have seen for many months, where the defensive sectors were leading the market, sometimes even when the S&P 500 was moving up. So the first takeaway from this observation is that the dominance of defensive sectors seems to be fading away, at least for now. The most eye-catching deviation is the almost straight line on the tail for XLU pushing the sector deeper into the lagging quadrant. On the opposite side, the cyclical sectors also show a diverse image. Materials and Financials are at strong rotations and inside the leading quadrant, while Real Estate and, more importantly, Consumer Discretionary are inside the lagging quadrant. And also, in the group of sensitive sectors, we find 2-2 opposing rotations. Energy and Industrials
To view this content you must be an active member of the CMT Association.
Not a member? Join the CMT Association and unlock access to hundreds of hours of written and video technical analysis content, including the Journal of Technical Analysis and the Video Archives. Learn more about Membership here.
Contributor(s)

Julius de Kempenaer
Julius de Kempenaer, Founder & Director, RRG Research & Sr. Technical Analyst at Stockcharts.com Julius de Kempenaer is the creator of Relative Rotation Graphs®, which have been available on Bloomberg since January 2011 under the mnemonic RRG<GO>. He is the...
The Fed Chair Ignites a Rally
by Greg Rieben December 01, 2022
Stocks were in need of a catalyst after trading mostly unchanged for two weeks and Fed Chair Jerome Powell delivered.
Every sector closed green…
Most of what Jerome Powell said at the November 2022 Fed meeting was not new and the market had already anticipated and discounted it over the last few weeks.
What really got the market going is what he said about the Fed’s December meeting. The Fed could “reduce the pace of rate increases as early as the December meeting…”
Bulls have been looking for a “pivot” and bears have been looking for Powell to crush the economy by continuing to increase rates aggressively. As it turns out, somewhere in the middle was good enough to get short sellers to cover and the underinvested to start buying.
We have been watching the put/call ratio closely over the last week which turned out to be a great contrarian indicator to keep a bullish bias.
We haven’t seen a put/call ratio print this high since the spring of 2020.
As far as the NASDAQ and S&P 500 are concerned, there are still considerable technical headwinds above that could create some problems moving forward, like the 200 day moving average and trendline resistance.
I’ve been expecting a broad market rally that would take price back to the levels shown above, but the reality is, many stocks bottomed months ago.
The public and media love to fixate on the S&P 500 and NASDAQ, but to me it’s not so much a “stock market” but more of a “market of stocks.”
If you are willing to look past the headlines and ignore the perma-bears, you can usually find a bull market somewhere.
A good place to start is with sectors and industries that are trading above their 200 day moving average.
Below are a few of the more popular and well known areas of the market that have shown relative strength the last few months and are now trading firmly above their 200 day moving averages:
DIA – Dow Jones Industrial Average
IVE – S&P 500 Value
XLB – Materials
IBB – Biotechnology
XLF – Financials
XOP – Oil & Gas
XLV – Health Care
XLI – Industrial
BJK – Gaming
XLB – Materials
XLP – Consumer Staples
COW.TO – Global Agriculture
XEG.TO – TSX Energy
XCG.TO – Canadian Growth
Is the bottom in? Or is this just another bear market rally?
Contributor(s)

Greg Rieben
Greg has more than 20 years of experience as an independent trader and investor with a demonstrated history of successfully guiding individuals through the challenges of managing their own portfolios. After graduating from university, he went to work for a Mutual fund company...
New Educational Content This Month
-
September 13, 2023
Charting and Analysis in Today’s Equity Markets
Presenter(s): Anthony F. Esposito, CMT
-
September 6, 2023
Market Trend Analysis
Presenter(s): Stephen W. Bigalow
-
August 30, 2023
Two New Oscillators – Volume Zone and Price Zone
Presenter(s): David Steckler