Secular trends in inflation adjusted equities average between 15 and 20 years. Since such price movements embrace a number of business cycles, identification of a reversal usually requires several years. If 2022 was the zenith of the post financial crisis bull market, the intervening year and a quarter is a relatively short period from which to conclude that a turn in the secular tide has taken place.
That said, several indicators have already begun to signal a change in trend. Our guess is that the odds favoring a secular peak are greater than 50/50, possibly as high as 60/40. Since the average inflation adjusted loss for a secular bear is around 65%, this is no small matter. Our first task is to outline why we think the odds narrowly favor a secular bear and then to outline what we might expect going forward.
The Case for a Secular Bear
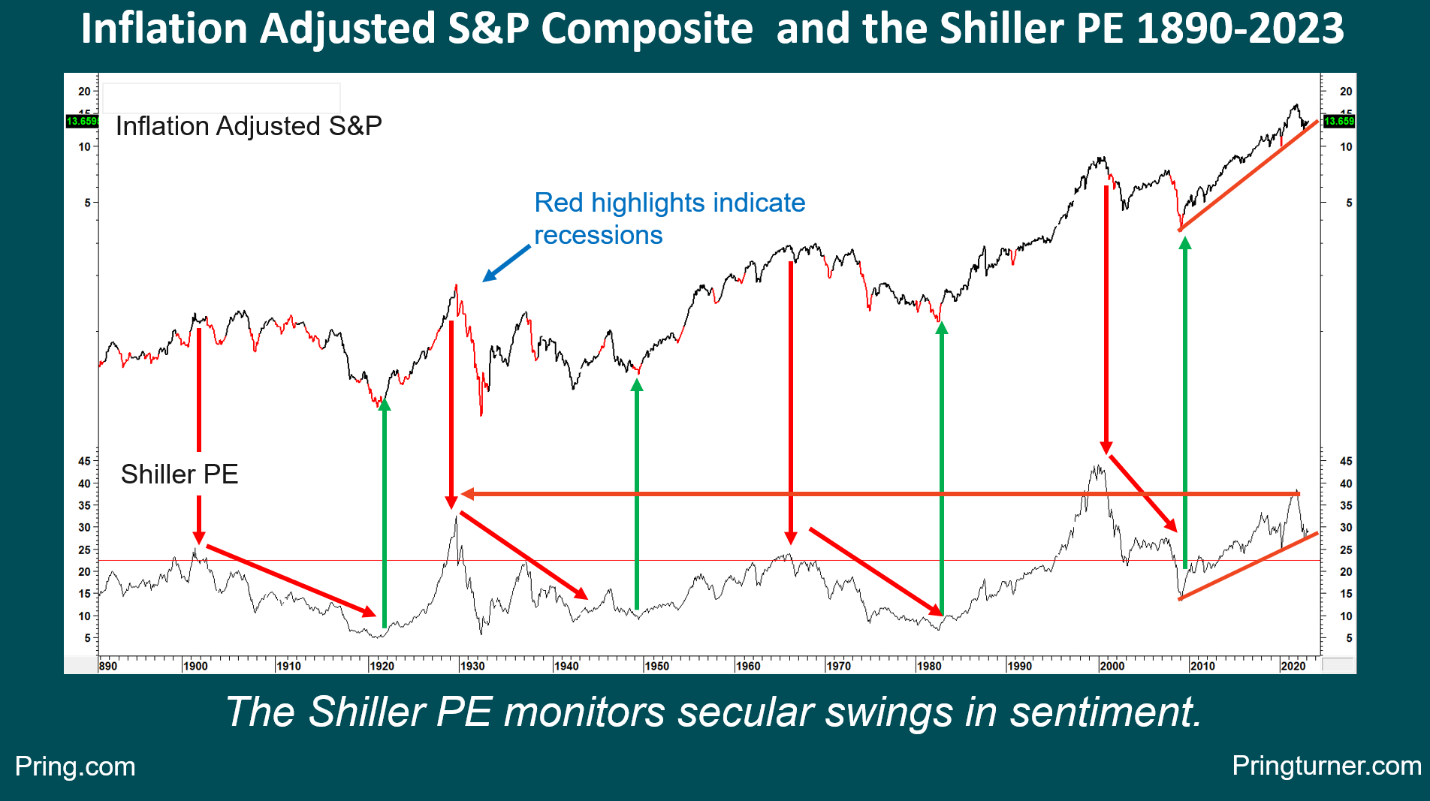
One of the characteristics of secular equity trends is that they are driven by giant swings in crowd psychology. In that respect, Chart 1 features the Shiller P/E. It may be a fundamental indicator, but we think of it more as a measure of sentiment. Otherwise, how can you rationalize the fact that in 1929 investors were willing to pay $32 for a dollar’s worth of earnings, indicating extreme optimism, but were literally throwing them away in 1932 at less than $6, because things seemed so bleak. Secular turning points have been characterized by the P/E moving to an extreme level in excess of 22.5 and subsequently reversing. That pattern has been repeated four times since 1901. In November 2021 the ratio reversed from its highest level ever, except for a few months surrounding the bursting of the tech bubble of 2000.
CHART 1 INFLATION ADJUSTED S&P AND THE SHILLER P/E
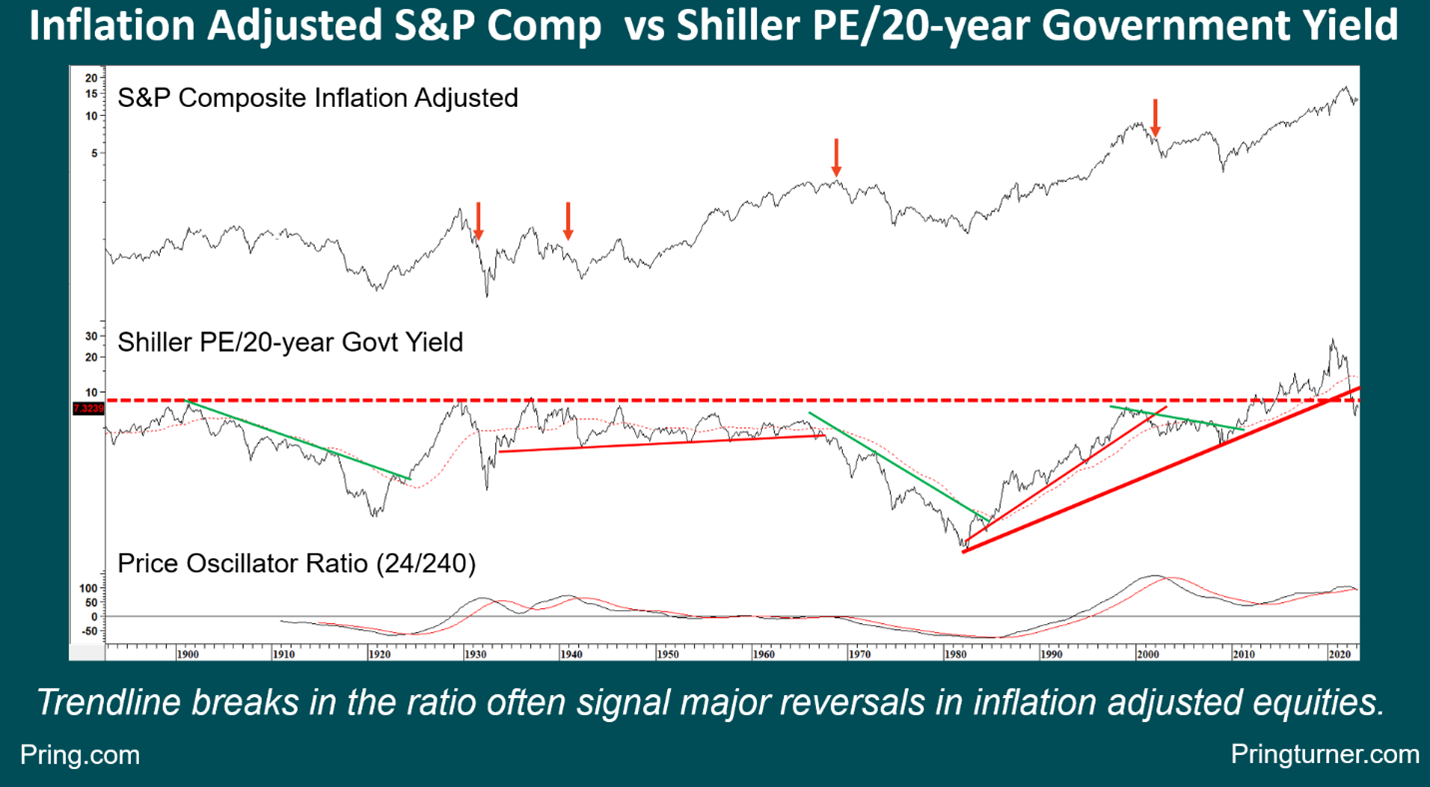
Another way of measuring the popularity of stocks is to compare the P/E to the yield on 20-year bonds. When the ratio is rising the indication is that stocks are growing in popularity. By that measure stocks reached a record level of acceptance in 2021. In the past this relationship has also lent itself to trendline construction, the violation of a multi-year line indicating a secular reversal. Earlier this year the ratio violated a 45-year up trendline. That should mean the price oscillator in the bottom window, which is close to its 48-month MA will drop below it, thereby generating its fifth sell signal since the turn of the previous century.
CHART 2 INFLATION ADJUSTED S&P AND THE SHILLER P/E/GOVT 20-YEAR YIELD RATIO
One of the conditions for a secular bear arises from structural problems in the economy. By way of rationale consider the high number of recessions that develop under a secular bearish environment. This can be observed from the red highlights in Chart 1. During the 1965-82 bear, for instance, there were four recessions, yet the subsequent 18-year secular bull experienced just one, a mild recession in 1990. It is also a fact that year over year CPI inflation in excess of 7.5% has, with the exception of 1957, only occurred under the context of a secular bear. The CPI peaked at 9% in June of last year.
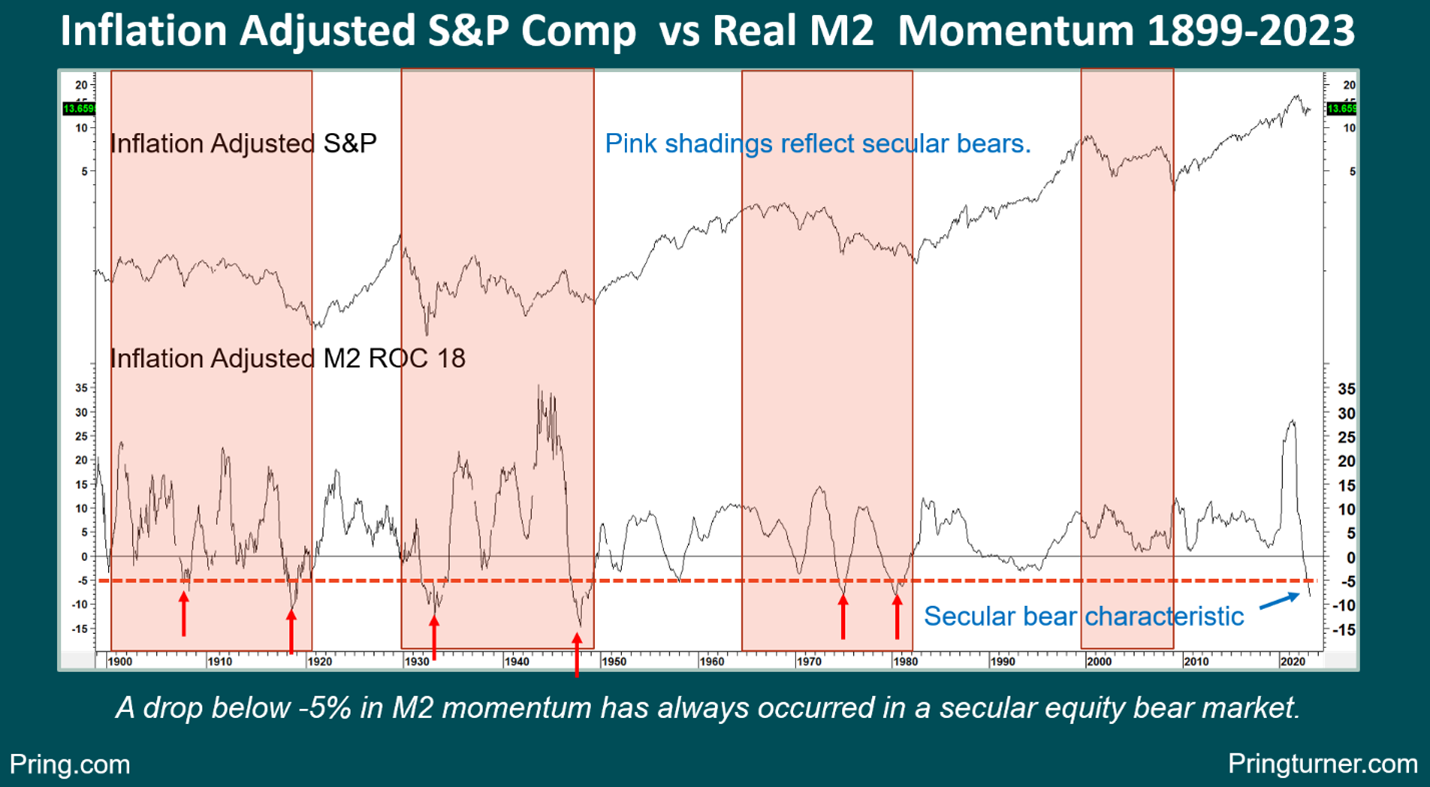
Chart 3 offers another example of a structural problem. In this respect, the pink shaded areas represent secular bear markets. Note that the 18-month ROC of inflation adjusted M2 is currently well below -5%. Every time that has happened in the past a secular bear has been underway, as evidenced by the small red arrows. If it walks like a duck and quacks like a duck, it probably is a duck!
CHART 3 INFLATION ADJUSTED S&P AND REAL M2 MOMENTUM
The bottom-line effect of all this is that, since 1900, the average primary bear market that developed in a secular uptrend lost 18% in inflation adjusted terms and took nine months to do it. During a secular bear those primary trend losses rose to 29% with an average 28-month duration.
WHERE DO WE GO FROM HERE?
If we assume that some kind of secular reversal has taken place, the question is what we should expect going forward. Chart 4 indicates that since 1901, there have been two types of top, a multi-year trading range and an abrupt inverted V. For example, the 1901-1920 bear evolved from a multi-year trading range with a downward bias. In this instance, serious damage only began many years after the 1901 peak. The 1966-82 bear was similar in nature. On the other hand, the inverted V variety developed immediately following the 1929 and 2007 highs.
CHART 4 INFLATION ADJUSTED S&P DEMONSTRATING TWO TYPES OF SECULAR TOP
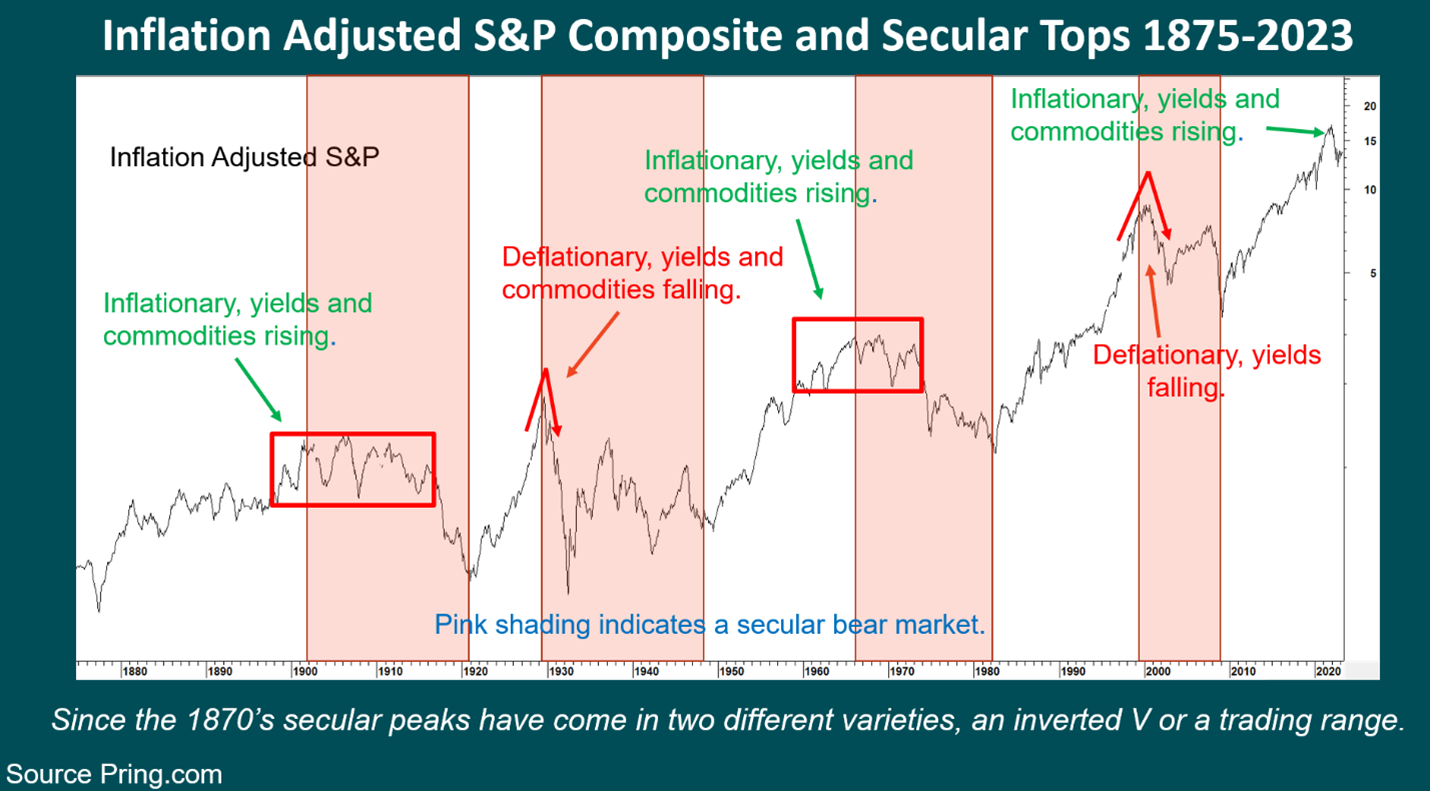
The longer-term implications are similar i.e., substantial inflation adjusted losses averaging 65%, spread over several business cycles. The two pathways though, are significantly different. An inverted V would involve the immediate taking out of last October’s low, whereas the trading range alternative would imply we are in a mini-bull market, possibly pushing prices to a new inflation adjusted high.
There are several reasons for expecting a rangebound scenario as being the more likely. First, many primary trend indicators are already arguing in favor of a new bull market. Second, since 1901 the two types have alternated. The 2007 peak was an inverted V, which implies that the next one would start with a trading range. Unfortunately, that observation is based on just four data points, which is insufficient to give us confidence in drawing such a momentous conclusion. Secular bears reflect long-term economic and financial structural problems, so a more practical approach is to examine the relationship between the secular trend of stocks, bond yields and commodities.
THE INTEGRATION OF THE SECULAR TREND OF BONDS, STOCKS, AND COMMODITIES
In that respect, Chart 5 compares the performance of equity prices and bonds since the start of the twentieth century. The secular equity bears have been identified by the pink shaded areas, and bulls by the unshaded ones. Logic would suggest that a long-term trend of rising yields would provide the ideal background for a secular equity bear market, because it would provide stocks with stiffer competition resulting in a P/E contraction. Alternatively, falling yields should stimulate the economy, while at the same time making stocks relatively more attractive than bonds. Both were true during the 1901-1920 bear and 1920-29 bull markets, as flagged by the double red and green arrows.
CHART 5 THE SECULAR TREND OF STOCKS COMPARED TO BONDS
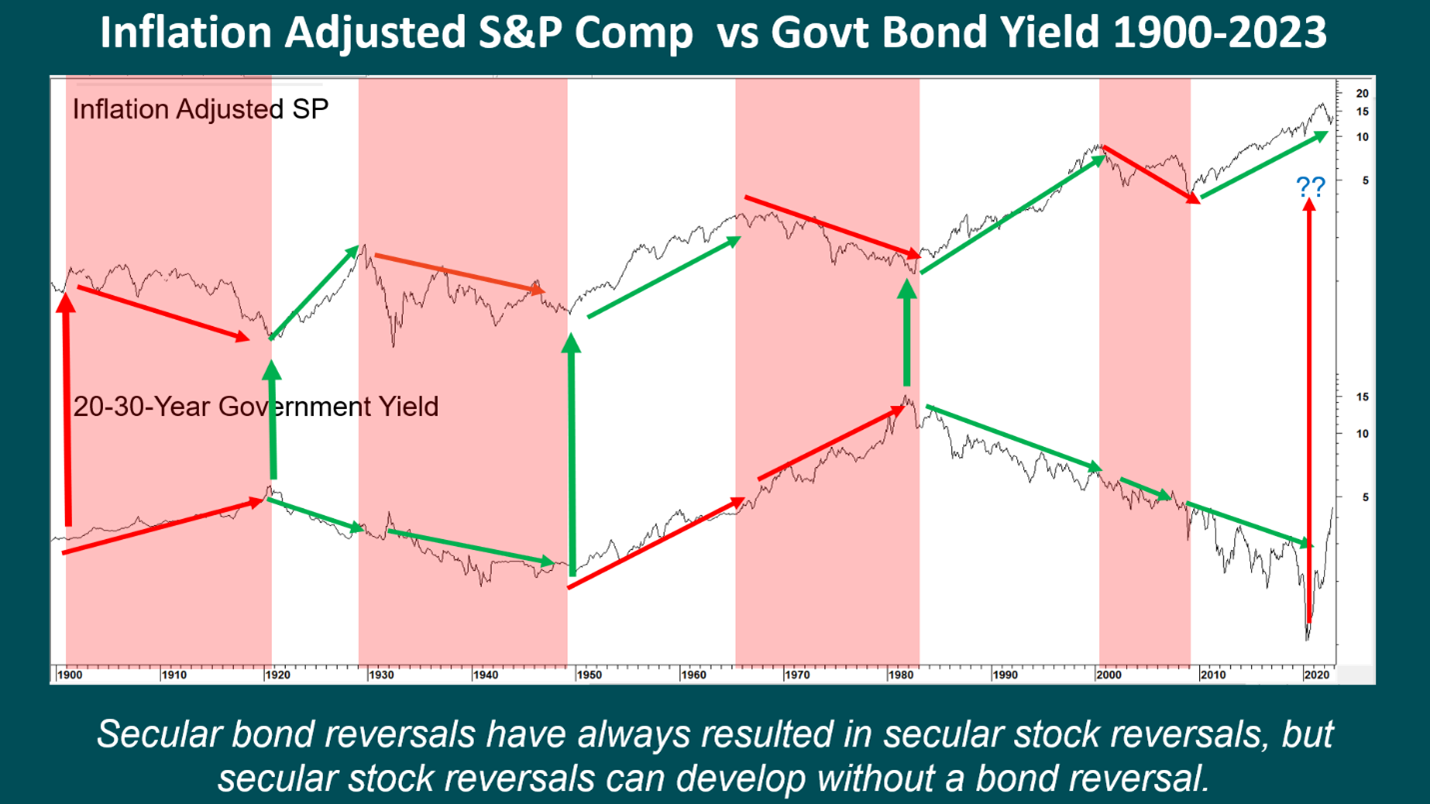
There are three other periods when “logic” prevailed with the appearance of joint red or green arrows. The most recent example was the post 2009 secular bull. Unfortunately, there are just as many exceptions in which prices and yields simultaneously rise or fall, demonstrating there is no consistent relationship between them. However, it is possible to say that all secular reversals in yields since 1900 have been associated with a secular reversal in equities. This is shown in the chart by the one red and three thick green vertical arrows. If we can show evidence of a secular reversal in bond yields, it is more likely that equities too are in the process of reversing.
THE SECULAR TREND FOR BOND YIELDS
Chart 6 offers that evidence in several formats. First, the 9-month EMA for the yield is above its 96-month counterpart, thereby earning a green highlight. This model has only experienced three small whipsaws since 1870, as shown by the ellipses. The magnitude of the current move has exceeded all of them, suggesting that the recent signal is valid. Second, the yield has violated a 40-year trendline that has been touched or closely approached 10 times. That’s a pretty big deal.
CHART 6 ANALYZING THE SECULAR TREND OF BOND YIELDS

Finally, the 18-month ROC has moved from a record oversold to a record overbought reading. This is known as an extreme swing and is a characteristic of a significant change in trend. Since it is a cyclical or primary trend indicator, the implication is for a reversal in the trend directly above it, namely the secular one. It is now time to examine the relationship between inflation adjusted equities and the secular trend of commodities.
THE SECULAR TREND FOR COMMODITIES
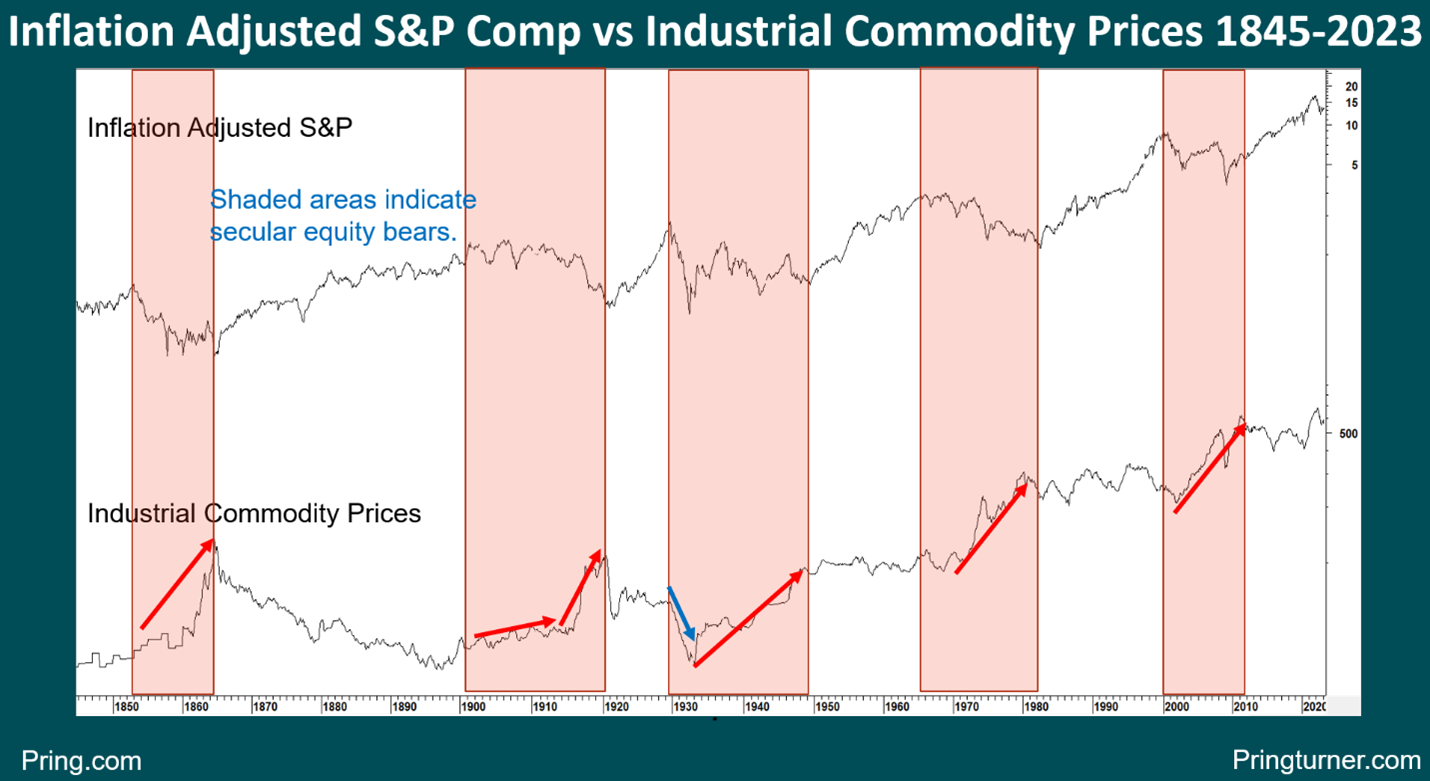
The shaded areas in Chart 7 reflect secular equity bears. Since 1845 all have been associated with sharply rising commodity prices, with one notable exception. That was, a pocket of sharp deflation that kicked off the1929-32 part of 1929-49 secular equity bear. Even that bear was subsequently associated with a secular commodity rally. If we can show that commodities are experiencing a secular bull market, history tells us that equities have most likely begun a secular bear.
CHART 7 INFLATION ADJUSTED S&P VS INDUSTRIAL COMMODITY PRICES
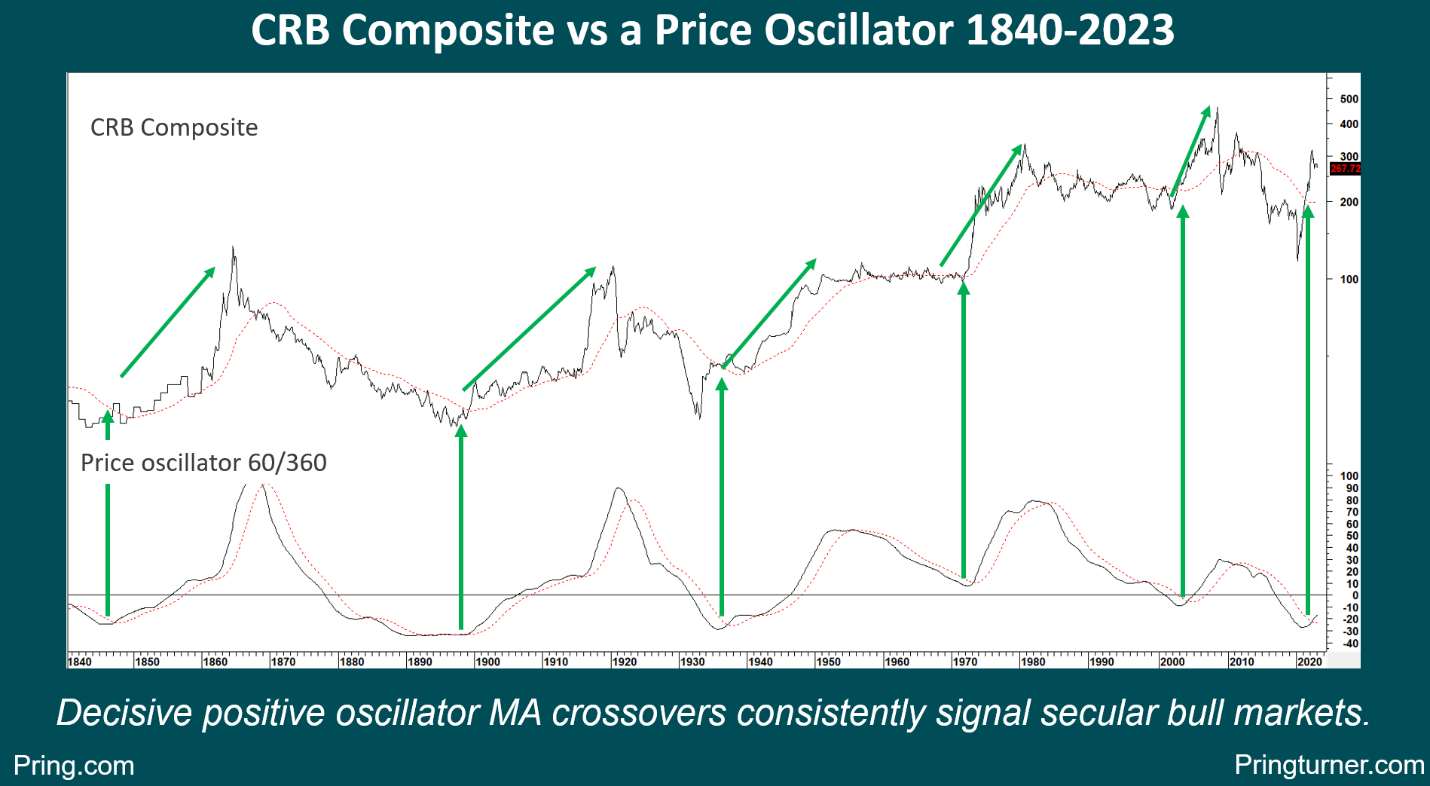
That evidence is presented in Chart 8 by the price oscillator using the 60- and 360-month parameters. This indicator triggers secular buy signals for the CRB Composite when it crosses above its 48-month moving average. Such a signal was recently given.
CHART 8 CRB COMPOSITE VS A 60/360 PRICE OSCILLATOR
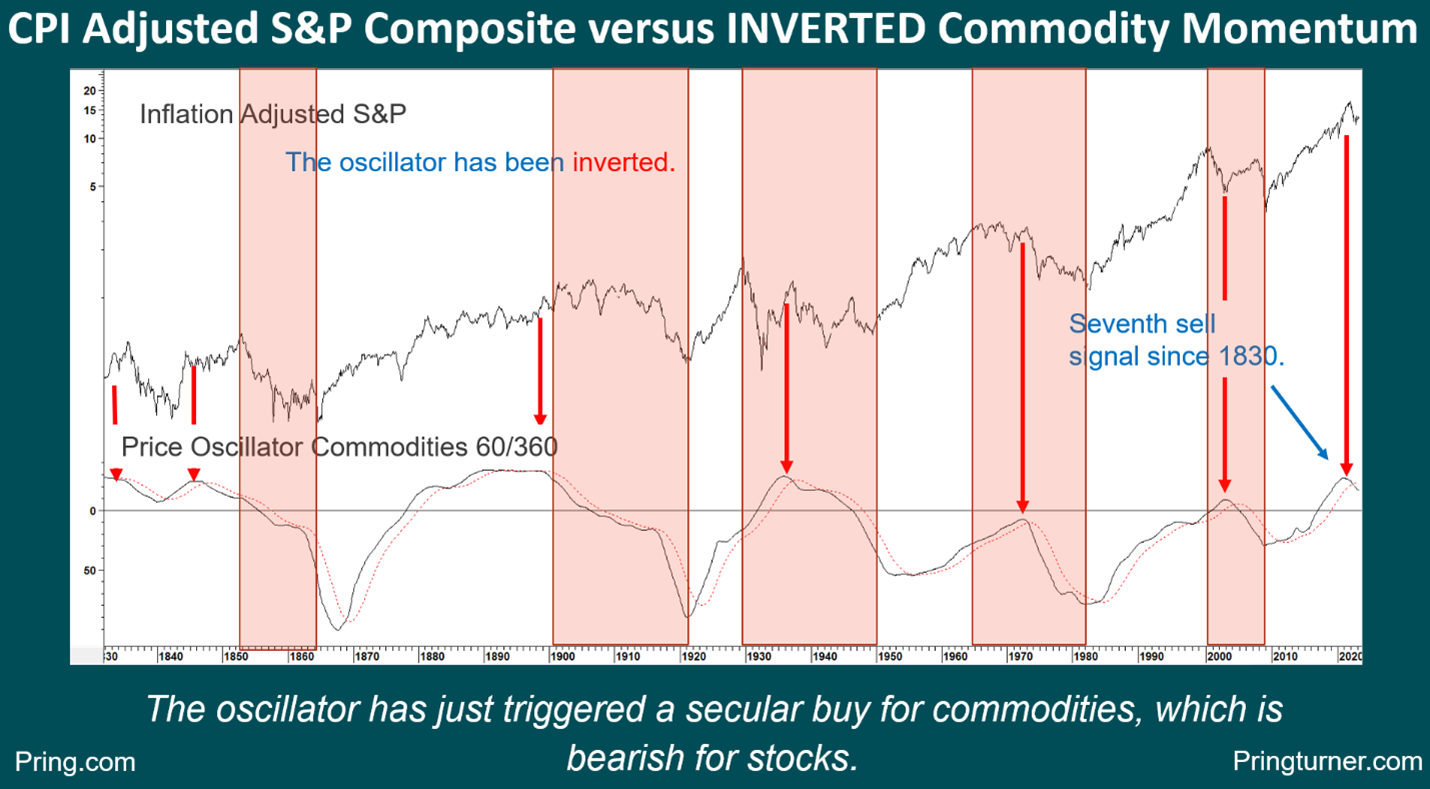
Finally, Chart 9 compares this 60/360 price oscillator to inflation adjusted equities. In this instance the oscillator has been inverted to correspond with swings in the S&P Composite. It is evident that every secular equity bear, indicated by the pink shading, has at some point experienced a period when the oscillator was below its MA i.e., commodities were in a secular bull market.
CHART 9 CRB COMPOSITE VS A 60/360 PRICE OSCILLATOR
BACK TO THE TOP
If we circle back to the original observation concerning two types of secular peak, it is now evident that both inverted V examples were associated with a secular trend of falling yields, whereas the trading range peaks of 1901 and 1966 experienced a secular trend of rising rates and commodities, which is the case with the current environment. A final observation comes from the fact that the “official” 1901 and 1966 secular peaks were temporarily exceeded in 1906 and 1968. That is not inconsistent with the bullish primary trend signals being triggered currently, but that is the subject for another article. In effect, marginal new all-time market highs as part of an overall topping out process can by no means be ruled out. Such action would probably fool the majority, which is what markets are supposed to do, isn’t it?


